Datenanalyse Teil III#
Natalie Widmann#
Wintersemester 2023 / 2024
Universität Leipzig
Ziel#
Wir visualisieren die Daten im EM-DAT Datensatz und bauen ein Länderdashboard damit.
# Install a pip package im Jupyter Notebook
!pip3 install pandas
Requirement already satisfied: pandas in /home/natalie/Dokumente/Datenjournalismus in Python/Code/.venv/lib/python3.11/site-packages (2.1.3)
Requirement already satisfied: numpy<2,>=1.23.2 in /home/natalie/Dokumente/Datenjournalismus in Python/Code/.venv/lib/python3.11/site-packages (from pandas) (1.26.2)
Requirement already satisfied: python-dateutil>=2.8.2 in /home/natalie/Dokumente/Datenjournalismus in Python/Code/.venv/lib/python3.11/site-packages (from pandas) (2.8.2)
Requirement already satisfied: pytz>=2020.1 in /home/natalie/Dokumente/Datenjournalismus in Python/Code/.venv/lib/python3.11/site-packages (from pandas) (2023.3.post1)
Requirement already satisfied: tzdata>=2022.1 in /home/natalie/Dokumente/Datenjournalismus in Python/Code/.venv/lib/python3.11/site-packages (from pandas) (2023.3)
Requirement already satisfied: six>=1.5 in /home/natalie/Dokumente/Datenjournalismus in Python/Code/.venv/lib/python3.11/site-packages (from python-dateutil>=2.8.2->pandas) (1.16.0)
import pandas as pd
pd.set_option('display.float_format', '{:.2f}'.format)

data = pd.read_csv('../../data/clean_emdat.csv', index_col=0)
data
| Year | Country | Disaster Subroup | Disaster Type | Disaster Subtype | Total Events | Total Affected | Total Deaths | Total Damage (USD, original) | |
|---|---|---|---|---|---|---|---|---|---|
| 1 | 2000 | Afghanistan | Climatological | Drought | Drought | 1 | 2580000.00 | 37.00 | 50000.00 |
| 2 | 2000 | Algeria | Hydrological | Flood | Flash flood | 2 | 105.00 | 37.00 | 1639896721.42 |
| 3 | 2000 | Algeria | Hydrological | Flood | Flood (General) | 2 | 100.00 | 7.00 | 1639896721.42 |
| 4 | 2000 | Algeria | Meteorological | Storm | Storm (General) | 1 | 10.00 | 4.00 | 1639896721.42 |
| 5 | 2000 | Angola | Hydrological | Flood | Flood (General) | 3 | 9011.00 | 15.00 | 1639896721.42 |
| ... | ... | ... | ... | ... | ... | ... | ... | ... | ... |
| 5834 | 2023 | Viet Nam | Meteorological | Storm | Tropical cyclone | 1 | 3.00 | 1.00 | 1639896721.42 |
| 5835 | 2023 | Yemen | Hydrological | Flood | Flood (General) | 1 | 169035.00 | 39.00 | 1639896721.42 |
| 5836 | 2023 | Zambia | Hydrological | Flood | Flash flood | 1 | 154608.00 | 0.00 | 1639896721.42 |
| 5837 | 2023 | Zambia | Hydrological | Flood | Flood (General) | 1 | 22000.00 | 0.00 | 1639896721.42 |
| 5838 | 2023 | Zimbabwe | Meteorological | Storm | Tropical cyclone | 1 | 2.00 | 2.00 | 1639896721.42 |
5838 rows × 9 columns
data.info()
<class 'pandas.core.frame.DataFrame'>
Index: 5838 entries, 1 to 5838
Data columns (total 9 columns):
 #   Column                        Non-Null Count  Dtype
---  ------                        --------------  -----
 0   Year                          5838 non-null   int64
 1   Country                       5838 non-null   object
 2   Disaster Subroup              5838 non-null   object
 3   Disaster Type                 5838 non-null   object
 4   Disaster Subtype              5838 non-null   object
 5   Total Events                  5838 non-null   int64
 6   Total Affected                5838 non-null   float64
 7   Total Deaths                  5838 non-null   float64
 8   Total Damage (USD, original)  5838 non-null   float64
dtypes: float64(3), int64(2), object(4)
memory usage: 456.1+ KB
Das Dashboard…#
Recherchefragen#
Wie viele Todesopfer gibt es in einem Land?
Wie stark ist ein Land von Naturkatastrophen betroffen?
Welchen Anteil haben die unterschiedlichen Naturkatastrophentypen daran?
Wie hat sich die Anzahl der Naturkatastrophen über die Jahre hin entwickelt?
Wie viele Todesopfer gibt es in einem Land?#
Wie viele Todesopfer gibt es insgesamt?#
data["Total Deaths"].sum()
1416055.0
Wie viele Todesopfer gibt es insgesamt in Deutschland?#
data['Country'] == 'Germany'
1       False
2       False
3       False
4       False
5       False
        ...
5834    False
5835    False
5836    False
5837    False
5838    False
Name: Country, Length: 5838, dtype: bool
data[data['Country'] == 'Germany']
| Year | Country | Disaster Subroup | Disaster Type | Disaster Subtype | Total Events | Total Affected | Total Deaths | Total Damage (USD, original) | |
|---|---|---|---|---|---|---|---|---|---|
| 370 | 2001 | Germany | Meteorological | Storm | Lightning/Thunderstorms | 1 | 6.00 | 6.00 | 300000000.00 |
| 636 | 2002 | Germany | Hydrological | Flood | Flood (General) | 1 | 330108.00 | 27.00 | 11600000000.00 |
| 637 | 2002 | Germany | Meteorological | Storm | Extra-tropical storm | 1 | 11.00 | 11.00 | 1800000000.00 |
| 638 | 2002 | Germany | Meteorological | Storm | Storm (General) | 2 | 19.00 | 11.00 | 250000000.00 |
| 929 | 2003 | Germany | Meteorological | Extreme temperature | Heat wave | 1 | 9355.00 | 9355.00 | 1650000000.00 |
| 930 | 2003 | Germany | Meteorological | Storm | Extra-tropical storm | 1 | 5.00 | 5.00 | 300000000.00 |
| 931 | 2003 | Germany | Meteorological | Storm | Lightning/Thunderstorms | 1 | 10.00 | 10.00 | 1639896721.42 |
| 1163 | 2004 | Germany | Geophysical | Earthquake | Ground movement | 1 | 150.00 | 0.00 | 12000000.00 |
| 1164 | 2004 | Germany | Meteorological | Storm | Storm (General) | 1 | 2.00 | 2.00 | 130000000.00 |
| 1434 | 2005 | Germany | Hydrological | Flood | Riverine flood | 2 | 450.00 | 1.00 | 220000000.00 |
| 1435 | 2005 | Germany | Meteorological | Extreme temperature | Cold wave | 1 | 165.00 | 1.00 | 300000000.00 |
| 1436 | 2005 | Germany | Meteorological | Storm | Extra-tropical storm | 1 | 2.00 | 2.00 | 270000000.00 |
| 1694 | 2006 | Germany | Hydrological | Flood | Riverine flood | 1 | 1000.00 | 0.00 | 1639896721.42 |
| 1695 | 2006 | Germany | Meteorological | Extreme temperature | Heat wave | 1 | 2.00 | 2.00 | 1639896721.42 |
| 1696 | 2006 | Germany | Meteorological | Extreme temperature | Severe winter conditions | 1 | 10.00 | 10.00 | 1639896721.42 |
| 1697 | 2006 | Germany | Meteorological | Storm | Hail | 1 | 100.00 | 1.00 | 1639896721.42 |
| 1698 | 2006 | Germany | Meteorological | Storm | Storm (General) | 2 | 200.00 | 10.00 | 1639896721.42 |
| 1948 | 2007 | Germany | Hydrological | Flood | Riverine flood | 1 | 1.00 | 1.00 | 1639896721.42 |
| 1949 | 2007 | Germany | Meteorological | Storm | Blizzard/Winter storm | 1 | 7.00 | 7.00 | 1639896721.42 |
| 1950 | 2007 | Germany | Meteorological | Storm | Extra-tropical storm | 1 | 130.00 | 11.00 | 5500000000.00 |
| 2205 | 2008 | Germany | Meteorological | Storm | Extra-tropical storm | 1 | 5.00 | 5.00 | 1200000000.00 |
| 2206 | 2008 | Germany | Meteorological | Storm | Severe weather | 1 | 3.00 | 3.00 | 1500000000.00 |
| 2435 | 2009 | Germany | Hydrological | Flood | Riverine flood | 1 | 0.00 | 0.00 | 20000000.00 |
| 2436 | 2009 | Germany | Meteorological | Extreme temperature | Cold wave | 2 | 15.00 | 15.00 | 1639896721.42 |
| 2437 | 2009 | Germany | Meteorological | Storm | Lightning/Thunderstorms | 1 | 1.00 | 1.00 | 50000000.00 |
| 2668 | 2010 | Germany | Hydrological | Flood | Flash flood | 1 | 3.00 | 3.00 | 1639896721.42 |
| 2669 | 2010 | Germany | Meteorological | Extreme temperature | Cold wave | 1 | 1.00 | 1.00 | 1639896721.42 |
| 2670 | 2010 | Germany | Meteorological | Storm | Blizzard/Winter storm | 1 | 0.00 | 0.00 | 1639896721.42 |
| 2671 | 2010 | Germany | Meteorological | Storm | Extra-tropical storm | 1 | 4.00 | 4.00 | 1000000000.00 |
| 2907 | 2011 | Germany | Hydrological | Flood | Riverine flood | 1 | 4.00 | 4.00 | 1639896721.42 |
| 3128 | 2012 | Germany | Meteorological | Extreme temperature | Cold wave | 2 | 6.00 | 6.00 | 1639896721.42 |
| 3334 | 2013 | Germany | Hydrological | Flood | Riverine flood | 1 | 6350.00 | 4.00 | 12900000000.00 |
| 3335 | 2013 | Germany | Meteorological | Storm | Extra-tropical storm | 2 | 2.00 | 7.00 | 1639896721.42 |
| 3336 | 2013 | Germany | Meteorological | Storm | Hail | 1 | 0.00 | 0.00 | 4800000000.00 |
| 3528 | 2014 | Germany | Meteorological | Storm | Lightning/Thunderstorms | 2 | 1.00 | 8.00 | 400000000.00 |
| 3987 | 2016 | Germany | Hydrological | Flood | Flood (General) | 1 | 7.00 | 7.00 | 2000000000.00 |
| 4219 | 2017 | Germany | Hydrological | Flood | Riverine flood | 1 | 600.00 | 0.00 | 1639896721.42 |
| 4220 | 2017 | Germany | Meteorological | Storm | Hail | 1 | 2.00 | 2.00 | 740000000.00 |
| 4221 | 2017 | Germany | Meteorological | Storm | Severe weather | 1 | 24.00 | 3.00 | 159000000.00 |
| 4448 | 2018 | Germany | Meteorological | Extreme temperature | Heat wave | 1 | 0.00 | 0.00 | 1639896721.42 |
| 4449 | 2018 | Germany | Meteorological | Storm | Extra-tropical storm | 1 | 12.00 | 5.00 | 588475000.00 |
| 4694 | 2019 | Germany | Meteorological | Extreme temperature | Heat wave | 2 | 4.00 | 4.00 | 1639896721.42 |
| 4695 | 2019 | Germany | Meteorological | Storm | Blizzard/Winter storm | 1 | 1.00 | 1.00 | 1639896721.42 |
| 4934 | 2020 | Germany | Meteorological | Storm | Extra-tropical storm | 1 | 33.00 | 0.00 | 1639896721.42 |
| 5194 | 2021 | Germany | Hydrological | Flood | Flood (General) | 1 | 1000.00 | 197.00 | 40000000000.00 |
| 5195 | 2021 | Germany | Meteorological | Storm | Lightning/Thunderstorms | 1 | 600.00 | 0.00 | 1639896721.42 |
| 5196 | 2021 | Germany | Meteorological | Storm | Storm (General) | 1 | 4.00 | 1.00 | 1639896721.42 |
| 5461 | 2022 | Germany | Meteorological | Extreme temperature | Heat wave | 1 | 8173.00 | 8173.00 | 1639896721.42 |
| 5462 | 2022 | Germany | Meteorological | Storm | Extra-tropical storm | 3 | 2.00 | 7.00 | 1023156000.00 |
| 5707 | 2023 | Germany | Meteorological | Storm | Severe weather | 1 | 1.00 | 1.00 | 1639896721.42 |
data[data['Country'] == 'Germany']['Total Deaths'].sum()
17935.0
data_germany = data[data['Country'] == 'Germany']
data_germany['Total Deaths'].sum()
17935.0
Wie viele Todesopfer gab es insgesamt in Indien?#
data_land = data[data['Country'] == 'India']
data_land['Total Deaths'].sum()
87391.0
Allgemeine Funktion die Gesamtzahl der Todesopfer eines Landes ausgibt#
def get_total_deaths(data, country):
    data_land = data[data['Country'] == country]
    return data_land['Total Deaths'].sum()
get_total_deaths(data, 'Japan')
23066.0
Dashboard Teil II#
Welchen Anteil haben die unterschiedlichen Naturkatastrophentypen in Deutschland?#
germany_data = data[data['Country'] == 'Germany']
germany_data['Disaster Type'].value_counts(normalize=True)
Disaster Type
Storm                 0.56
Flood                 0.22
Extreme temperature   0.20
Earthquake            0.02
Name: proportion, dtype: float64
Visualisierung von DataFrames#
Matplotlib is a comprehensive library for creating static, animated, and interactive visualizations in Python.
Matplotlib makes easy things easy and hard things possible.
Install matplotlib:
!pip3 install --upgrade pip
!pip3 install --upgrade Pillow
!pip3 install matplotlib

import matplotlib.pyplot as plt
Requirement already satisfied: pip in /home/natalie/Dokumente/Datenjournalismus in Python/Code/.venv/lib/python3.11/site-packages (23.3.1)
Requirement already satisfied: Pillow in /home/natalie/Dokumente/Datenjournalismus in Python/Code/.venv/lib/python3.11/site-packages (10.1.0)
Requirement already satisfied: matplotlib in /home/natalie/Dokumente/Datenjournalismus in Python/Code/.venv/lib/python3.11/site-packages (3.8.2)
Requirement already satisfied: contourpy>=1.0.1 in /home/natalie/Dokumente/Datenjournalismus in Python/Code/.venv/lib/python3.11/site-packages (from matplotlib) (1.2.0)
Requirement already satisfied: cycler>=0.10 in /home/natalie/Dokumente/Datenjournalismus in Python/Code/.venv/lib/python3.11/site-packages (from matplotlib) (0.12.1)
Requirement already satisfied: fonttools>=4.22.0 in /home/natalie/Dokumente/Datenjournalismus in Python/Code/.venv/lib/python3.11/site-packages (from matplotlib) (4.46.0)
Requirement already satisfied: kiwisolver>=1.3.1 in /home/natalie/Dokumente/Datenjournalismus in Python/Code/.venv/lib/python3.11/site-packages (from matplotlib) (1.4.5)
Requirement already satisfied: numpy<2,>=1.21 in /home/natalie/Dokumente/Datenjournalismus in Python/Code/.venv/lib/python3.11/site-packages (from matplotlib) (1.26.2)
Requirement already satisfied: packaging>=20.0 in /home/natalie/Dokumente/Datenjournalismus in Python/Code/.venv/lib/python3.11/site-packages (from matplotlib) (23.2)
Requirement already satisfied: pillow>=8 in /home/natalie/Dokumente/Datenjournalismus in Python/Code/.venv/lib/python3.11/site-packages (from matplotlib) (10.1.0)
Requirement already satisfied: pyparsing>=2.3.1 in /home/natalie/Dokumente/Datenjournalismus in Python/Code/.venv/lib/python3.11/site-packages (from matplotlib) (3.1.1)
Requirement already satisfied: python-dateutil>=2.7 in /home/natalie/Dokumente/Datenjournalismus in Python/Code/.venv/lib/python3.11/site-packages (from matplotlib) (2.8.2)
Requirement already satisfied: six>=1.5 in /home/natalie/Dokumente/Datenjournalismus in Python/Code/.venv/lib/python3.11/site-packages (from python-dateutil>=2.7->matplotlib) (1.16.0)
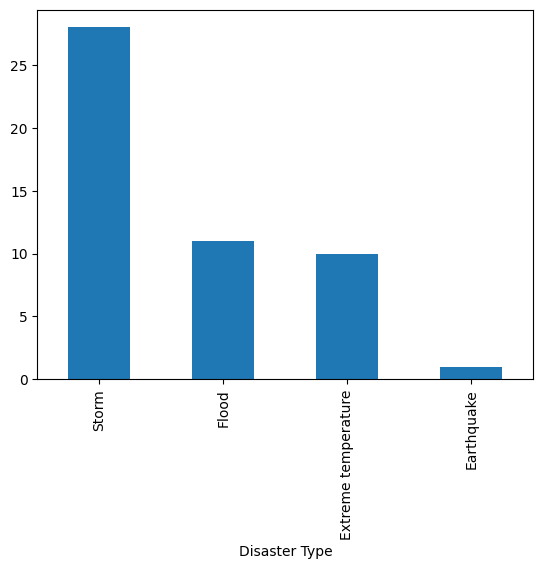
germany_data = data[data['Country'] == 'Germany']
germany_data['Disaster Type'].value_counts()
Disaster Type
Storm                  28
Flood                  11
Extreme temperature    10
Earthquake              1
Name: count, dtype: int64
germany_data['Disaster Type'].value_counts().plot(kind='bar')
<Axes: xlabel='Disaster Type'>
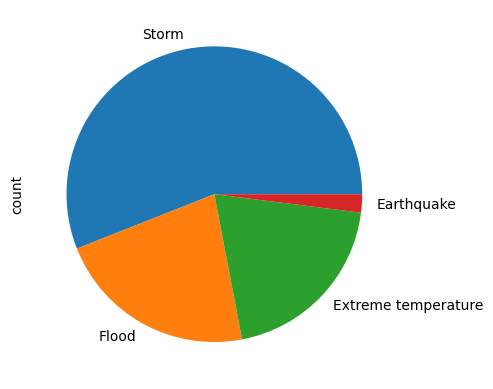
germany_data['Disaster Type'].value_counts().plot(kind='pie')
<Axes: ylabel='count'>
Recherchefragen#
Welche Naturkatastrophen fordern die meisten Todesopfer?#
.groupby() gruppiert einen DataFrame nach den Werten einer oder mehreren Spalten.
Die Spalten nach denen man Gruppieren möchte werden als Argument übergeben. Danach folgt die gewünschte Berechnung auf dieser Gruppe. Das Ergebnis wird als DataFrame zurückgegeben.
data
| Year | Country | Disaster Subroup | Disaster Type | Disaster Subtype | Total Events | Total Affected | Total Deaths | Total Damage (USD, original) | |
|---|---|---|---|---|---|---|---|---|---|
| 1 | 2000 | Afghanistan | Climatological | Drought | Drought | 1 | 2580000.00 | 37.00 | 50000.00 |
| 2 | 2000 | Algeria | Hydrological | Flood | Flash flood | 2 | 105.00 | 37.00 | 1639896721.42 |
| 3 | 2000 | Algeria | Hydrological | Flood | Flood (General) | 2 | 100.00 | 7.00 | 1639896721.42 |
| 4 | 2000 | Algeria | Meteorological | Storm | Storm (General) | 1 | 10.00 | 4.00 | 1639896721.42 |
| 5 | 2000 | Angola | Hydrological | Flood | Flood (General) | 3 | 9011.00 | 15.00 | 1639896721.42 |
| ... | ... | ... | ... | ... | ... | ... | ... | ... | ... |
| 5834 | 2023 | Viet Nam | Meteorological | Storm | Tropical cyclone | 1 | 3.00 | 1.00 | 1639896721.42 |
| 5835 | 2023 | Yemen | Hydrological | Flood | Flood (General) | 1 | 169035.00 | 39.00 | 1639896721.42 |
| 5836 | 2023 | Zambia | Hydrological | Flood | Flash flood | 1 | 154608.00 | 0.00 | 1639896721.42 |
| 5837 | 2023 | Zambia | Hydrological | Flood | Flood (General) | 1 | 22000.00 | 0.00 | 1639896721.42 |
| 5838 | 2023 | Zimbabwe | Meteorological | Storm | Tropical cyclone | 1 | 2.00 | 2.00 | 1639896721.42 |
5838 rows × 9 columns
data['Total Deaths'].sum()
1416055.0
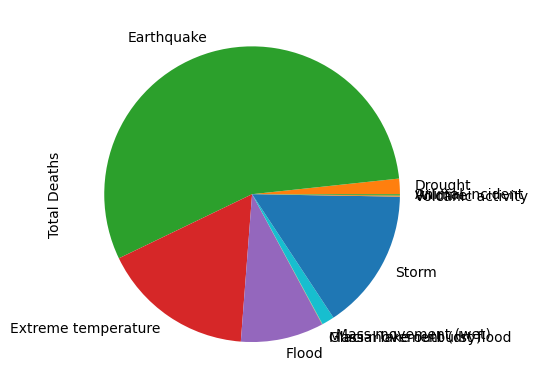
data.groupby('Disaster Type')['Total Deaths'].sum()
Disaster Type
Animal incident                   12.00
Drought                        23913.00
Earthquake                    785228.00
Extreme temperature           235687.00
Flood                         128317.00
Glacial lake outburst flood      439.00
Impact                             0.00
Infestation                        0.00
Mass movement (dry)              382.00
Mass movement (wet)            19413.00
Storm                         218907.00
Volcanic activity               1711.00
Wildfire                        2046.00
Name: Total Deaths, dtype: float64
.groupby() kann auch auf mehrere Spalten gleichzeitig angewendet werden
data.groupby(['Disaster Type', 'Disaster Subtype'])['Total Deaths'].sum()
Disaster Type                Disaster Subtype
Animal incident              Animal incident                        12.00
Drought                      Drought                             23913.00
Earthquake                   Ground movement                    532498.00
                             Tsunami                            252730.00
Extreme temperature          Cold wave                           11323.00
                             Heat wave                          220684.00
                             Severe winter conditions             3680.00
Flood                        Coastal flood                         606.00
                             Flash flood                         24663.00
                             Flood (General)                     33094.00
                             Riverine flood                      69954.00
Glacial lake outburst flood  Glacial lake outburst flood           439.00
Impact                       Collision                               0.00
Infestation                  Locust infestation                      0.00
                             Worms infestation                       0.00
Mass movement (dry)          Avalanche (dry)                        16.00
                             Landslide (dry)                       247.00
                             Rockfall (dry)                        119.00
Mass movement (wet)          Avalanche (wet)                      1856.00
                             Landslide (wet)                     14504.00
                             Mudslide                             2638.00
                             Rockfall (wet)                        128.00
                             Sudden Subsidence (wet)               287.00
Storm                        Blizzard/Winter storm                2779.00
                             Derecho                                24.00
                             Extra-tropical storm                  363.00
                             Hail                                  302.00
                             Lightning/Thunderstorms              2061.00
                             Sand/Dust storm                       316.00
                             Severe weather                       1256.00
                             Storm (General)                     15590.00
                             Storm surge                            52.00
                             Tornado                              2085.00
                             Tropical cyclone                   194079.00
Volcanic activity            Ash fall                              630.00
                             Lava flow                              33.00
                             Pyroclastic flow                      532.00
                             Volcanic activity (General)           516.00
Wildfire                     Forest fire                          1080.00
                             Land fire (Brush, Bush, Pasture)      487.00
                             Wildfire (General)                    479.00
Name: Total Deaths, dtype: float64
data.groupby('Disaster Type')
<pandas.core.groupby.generic.DataFrameGroupBy object at 0x7f335898ba50>
Visualisierung#
data.groupby('Disaster Type')['Total Deaths'].sum().plot(kind='pie')
<Axes: ylabel='Total Deaths'>
Welche Naturkatastrophen fordern die meisten Todesopfer in Deutschland?#
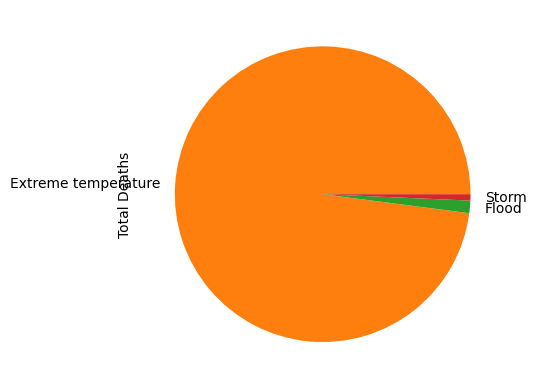
germany_data = data[data['Country'] == 'Germany']
germany_data.groupby('Disaster Type')['Total Deaths'].sum().plot(kind='pie')
<Axes: ylabel='Total Deaths'>
Generelle Funktion#
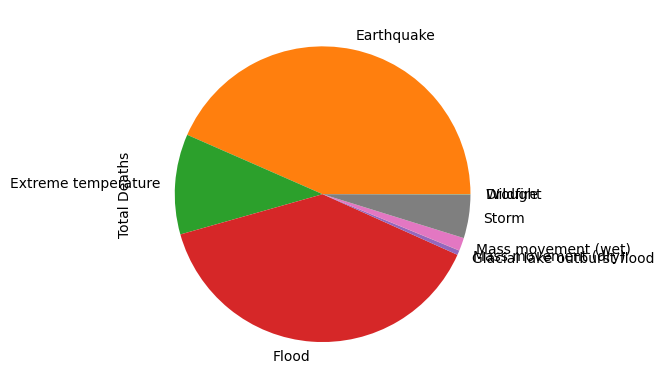
country = 'India'
country_data = data[data['Country'] == country]
country_data.groupby('Disaster Type')['Total Deaths'].sum().plot(kind='pie')
<Axes: ylabel='Total Deaths'>
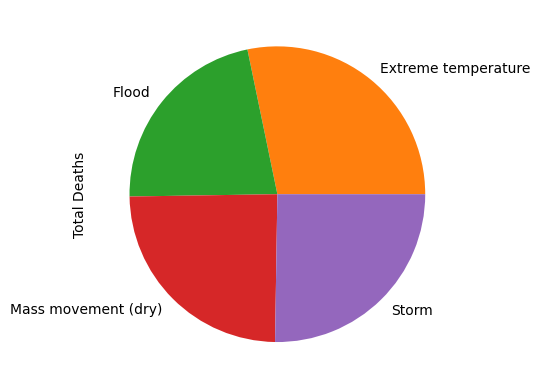
def plot_death_by_disastertype(data, country):
    country_data = data[data['Country'] == country]
    country_data.groupby('Disaster Type')['Total Deaths'].sum().plot(kind='pie')
plot_death_by_disastertype(data, 'Egypt')
Dashboard Teil III#
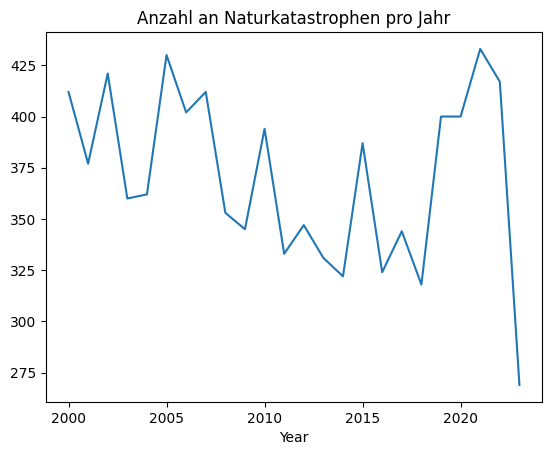
Wie hat sich die Anzahl der Naturkatastrophen über die Jahre hin entwickelt?#
Berechne für jedes Jahr die Summe aus allen Events
data.groupby('Year')['Total Events'].sum()
Year
2000    412
2001    377
2002    421
2003    360
2004    362
2005    430
2006    402
2007    412
2008    353
2009    345
2010    394
2011    333
2012    347
2013    331
2014    322
2015    387
2016    324
2017    344
2018    318
2019    400
2020    400
2021    433
2022    417
2023    269
Name: Total Events, dtype: int64
data['Total Events'].sum()
8893
data.groupby('Year').min()
| Country | Disaster Subroup | Disaster Type | Disaster Subtype | Total Events | Total Affected | Total Deaths | Total Damage (USD, original) | |
|---|---|---|---|---|---|---|---|---|
| Year | ||||||||
| 2000 | Afghanistan | Biological | Drought | Ash fall | 1 | 0.00 | 0.00 | 35000.00 |
| 2001 | Afghanistan | Biological | Drought | Ash fall | 1 | 0.00 | 0.00 | 10000.00 |
| 2002 | Afghanistan | Climatological | Drought | Ash fall | 1 | 0.00 | 0.00 | 30000.00 |
| 2003 | Afghanistan | Climatological | Drought | Ash fall | 1 | 0.00 | 0.00 | 50000.00 |
| 2004 | Afghanistan | Biological | Drought | Ash fall | 1 | 0.00 | 0.00 | 173000.00 |
| 2005 | Afghanistan | Climatological | Drought | Ash fall | 1 | 0.00 | 0.00 | 20000.00 |
| 2006 | Afghanistan | Biological | Drought | Ash fall | 1 | 0.00 | 0.00 | 500000.00 |
| 2007 | Afghanistan | Climatological | Drought | Ash fall | 1 | 0.00 | 0.00 | 9000.00 |
| 2008 | Afghanistan | Climatological | Drought | Ash fall | 1 | 0.00 | 0.00 | 29000.00 |
| 2009 | Afghanistan | Biological | Drought | Ash fall | 1 | 0.00 | 0.00 | 5000.00 |
| 2010 | Afghanistan | Biological | Drought | Ash fall | 1 | 0.00 | 0.00 | 78000.00 |
| 2011 | Afghanistan | Climatological | Drought | Ash fall | 1 | 0.00 | 0.00 | 123000.00 |
| 2012 | Afghanistan | Climatological | Drought | Ash fall | 1 | 0.00 | 0.00 | 760000.00 |
| 2013 | Afghanistan | Climatological | Drought | Ash fall | 1 | 0.00 | 0.00 | 102000.00 |
| 2014 | Afghanistan | Biological | Animal incident | Animal incident | 1 | 0.00 | 0.00 | 791000.00 |
| 2015 | Afghanistan | Climatological | Drought | Ash fall | 1 | 0.00 | 0.00 | 2000.00 |
| 2016 | Afghanistan | Climatological | Drought | Avalanche (wet) | 1 | 0.00 | 0.00 | 50000.00 |
| 2017 | Afghanistan | Climatological | Drought | Ash fall | 1 | 0.00 | 0.00 | 1655000.00 |
| 2018 | Afghanistan | Climatological | Drought | Ash fall | 1 | 0.00 | 0.00 | 36000.00 |
| 2019 | Afghanistan | Biological | Drought | Ash fall | 1 | 0.00 | 0.00 | 4000000.00 |
| 2020 | Afghanistan | Biological | Drought | Ash fall | 1 | 0.00 | 0.00 | 1500000.00 |
| 2021 | Afghanistan | Climatological | Drought | Ash fall | 1 | 0.00 | 0.00 | 120000.00 |
| 2022 | Afghanistan | Climatological | Drought | Ash fall | 1 | 0.00 | 0.00 | 0.00 |
| 2023 | Afghanistan | Climatological | Drought | Ash fall | 1 | 0.00 | 0.00 | 1000000.00 |
data[['Total Events', 'Year']].groupby('Year')['Total Events'].sum()
Year
2000    412
2001    377
2002    421
2003    360
2004    362
2005    430
2006    402
2007    412
2008    353
2009    345
2010    394
2011    333
2012    347
2013    331
2014    322
2015    387
2016    324
2017    344
2018    318
2019    400
2020    400
2021    433
2022    417
2023    269
Name: Total Events, dtype: int64
yearly_events = data.groupby('Year')['Total Events'].sum()
yearly_events.plot(kind='line', x='Year', y='Total Events', title='Anzahl an Naturkatastrophen pro Jahr')
<Axes: title={'center': 'Anzahl an Naturkatastrophen pro Jahr'}, xlabel='Year'>
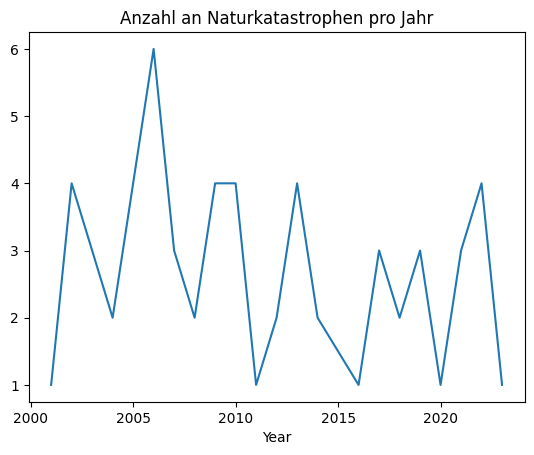
Plotte für Deutschland die Entwicklung der Anzahl an Naturkatastrophen über die Jahre hinweg
yearly_events =germany_data.groupby('Year')['Total Events'].sum()
yearly_events.plot(kind='line', x='Year', y='Total Events', title='Anzahl an Naturkatastrophen pro Jahr')
<Axes: title={'center': 'Anzahl an Naturkatastrophen pro Jahr'}, xlabel='Year'>
Generelle Funktion
def plot_evolution(data, country):
    land_data = data[data['Country'] == county]
    yearly_events = land_data.groupby('Year')['Total Events'].sum()
    yearly_events.plot(kind='line', x='Year', y='Total Events', title='Anzahl an Naturkatastrophen pro Jahr')
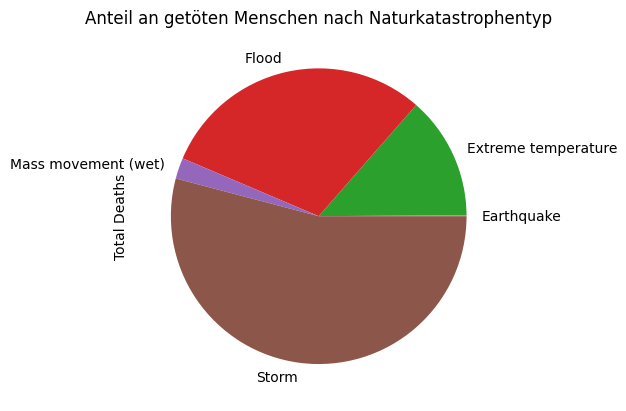
Länderdashboard#
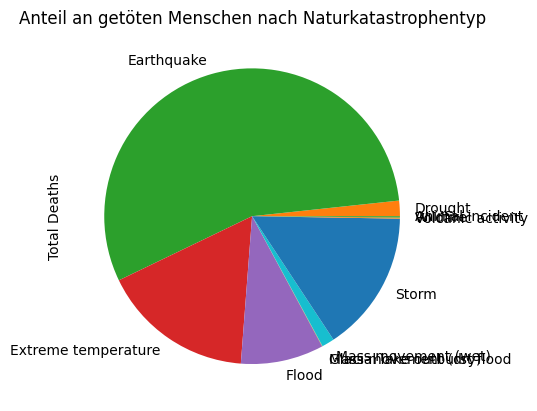
def plot_pie(country_data):
    country_data.groupby('Disaster Type')['Total Deaths'].sum().plot(kind='pie', title='Anteil an getöten Menschen nach Naturkatastrophentyp')
    plt.show()
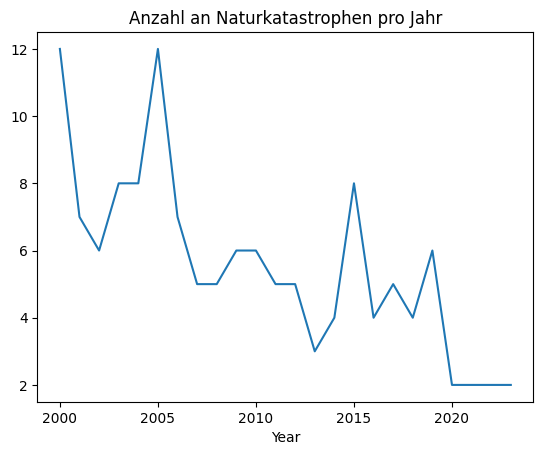
def plot_time_evolution(country_data):
    yearly_events = country_data.groupby('Year')['Total Events'].sum()
    yearly_events.plot(kind='line', x='Year', y='Total Events', title='Anzahl an Naturkatastrophen pro Jahr')
    plt.show()
def death_overview(country_data):
    total_deaths = country_data["Total Deaths"].sum()
    print(f'Getötete Menschen seit 1900: {total_deaths:,.0f}')
def compute_anteil(country_total, world_total):
    anteil = round(country_total / (world_total / 100.0), 2)
    print(f'{anteil}% aller Menschen die weltweit von Naturkatastrophen betroffen sind leben hier.')
def analyze(data, country):
    print(f'Naturkatastrophen in {country.upper()} \n')
    country_data = data[data['Country'] == country]

    # compute_anteil(country_data['Total Affected'].sum(), data['Total Affected'].sum())
    text = death_overview(country_data)
    plot_pie(country_data)
    plot_time_evolution(country_data)
analyze(data, 'Bangladesh')
Naturkatastrophen in BANGLADESH

Getötete Menschen seit 1900: 11,564
Überblick über die Welt#
Wie können wir die selbstdefinierte Funktion analyze() anpassen, so dass auch eine Gesamtstatistik, die alle Länder der Welt enthält abgefragt werden kann?
def analyze(data, country):
    print(f'Naturkatastrophen in {country.upper()} \n')
    country_data = data[data['Country'] == country]
    if country == 'world':
        country_data = data
    compute_anteil(country_data['Total Affected'].sum(), data['Total Affected'].sum())
    death_overview(country_data)
    plot_pie(country_data)
    plot_time_evolution(country_data)
analyze(data, 'world')
Naturkatastrophen in WORLD

100.0% aller Menschen die weltweit von Naturkatastrophen betroffen sind leben hier.
Getötete Menschen seit 1900: 1,416,055