Weitere Schritte mit Pandas#
Indexing & Cleaning#
Lade deinen Datensatz von letzter Woche relativ zu deinem Arbeitsverzeichnis. Formatiere deinen DataFrame anschließend so, dass die Column ‘Date’ als neuer Index fungiert.
# Code
Show code cell source
import pandas as pd

df = pd.read_csv('data/city-stats.csv')

df = df.set_index('Date')
Lösche die Column mit den wenigsten Seitenaufrufen
# Code
Show code cell source
#df.pop(df.sum().idxmin())

df.drop(df.sum().idxmin(), axis=1)

#del df[df.sum().idxmin()]
| Berlin | München | Leipzig | Stuttgart | |
|---|---|---|---|---|
| Date | ||||
| 2020-10 | 13436 | 5129 | 1287 | 1676 |
| 2020-11 | 15673 | 3629 | 1172 | 1870 |
| 2020-12 | 12500 | 3334 | 1104 | 1589 |
| 2021-01 | 12368 | 4476 | 1462 | 1979 |
| 2021-02 | 20432 | 5712 | 1933 | 3559 |
| 2021-03 | 22500 | 6668 | 1947 | 3238 |
| 2021-04 | 13439 | 4014 | 1629 | 1817 |
| 2021-05 | 5668 | 1834 | 1241 | 2144 |
| 2021-06 | 9887 | 2697 | 1683 | 1079 |
| 2021-07 | 6211 | 2137 | 808 | 981 |
| 2021-08 | 10759 | 2133 | 1235 | 1373 |
| 2021-09 | 5556 | 1711 | 986 | 1055 |
| 2021-10 | 6053 | 3683 | 1279 | 1225 |
| 2021-11 | 7455 | 2020 | 1153 | 1273 |
| 2021-12 | 8865 | 2872 | 2118 | 1619 |
| 2022-01 | 12223 | 3872 | 2554 | 1820 |
| 2022-02 | 3620 | 1648 | 1161 | 1172 |
| 2022-03 | 5006 | 2333 | 1131 | 1101 |
| 2022-04 | 7528 | 2144 | 1167 | 1225 |
| 2022-05 | 8110 | 20529 | 1326 | 1229 |
| 2022-06 | 9112 | 21624 | 1103 | 906 |
| 2022-07 | 10268 | 4255 | 3931 | 3061 |
| 2022-08 | 17969 | 10034 | 6358 | 5666 |
| 2022-09 | 20162 | 10399 | 6607 | 7169 |
| 2022-10 | 20790 | 7277 | 7148 | 7093 |
Füge dem DataFrame eine weitere Zeile hinzu, in der die durchschnittlichen Aufrufzahlen der jeweiligen Seite angezeigt werden.
# Code
Show code cell source
'''
Um neue Zeilen und Spalten hinzuzufügen, werden unterschiedliche Schreibweisen verwendet.
Neue Zeilen müssen mit hilfe von loc zugewiesen werden, neue Spalten mit der bekannten Zuweisung in eckigen Klammern.
Beachte in diesem Fall, dass sich der Parameter 'axis' genau umgekehrt zu drop verhält.
Default wird die Funktion auf jede Spalte angewandt, um den Durchschnitt einer Zeile zu errechnen, muss 'axis' auf 1 gesetzt werden.
'''
data.loc['Durchschnitt'] = data.mean()
data['Tagesdurchschnitt'] = [1,2,3,4,5,6,7,8,9,10,11,12,13,14,15,16,17,18,19,20,21,22]
data['Tagesdurchschnitt'] = {'2022-10-26':1, '2022-10-27': 5}
data
| Berlin | München | Leipzig | Stuttgart | Köln | |
|---|---|---|---|---|---|
| Date | |||||
| 2020-10 | 13436.0 | 5129.00 | 1287.00 | 1676.00 | 1911.00 |
| 2020-11 | 15673.0 | 3629.00 | 1172.00 | 1870.00 | 2713.00 |
| 2020-12 | 12500.0 | 3334.00 | 1104.00 | 1589.00 | 1854.00 |
| 2021-01 | 12368.0 | 4476.00 | 1462.00 | 1979.00 | 2766.00 |
| 2021-02 | 20432.0 | 5712.00 | 1933.00 | 3559.00 | 3191.00 |
| 2021-03 | 22500.0 | 6668.00 | 1947.00 | 3238.00 | 3598.00 |
| 2021-04 | 13439.0 | 4014.00 | 1629.00 | 1817.00 | 1991.00 |
| 2021-05 | 5668.0 | 1834.00 | 1241.00 | 2144.00 | 1534.00 |
| 2021-06 | 9887.0 | 2697.00 | 1683.00 | 1079.00 | 1726.00 |
| 2021-07 | 6211.0 | 2137.00 | 808.00 | 981.00 | 1097.00 |
| 2021-08 | 10759.0 | 2133.00 | 1235.00 | 1373.00 | 1535.00 |
| 2021-09 | 5556.0 | 1711.00 | 986.00 | 1055.00 | 1134.00 |
| 2021-10 | 6053.0 | 3683.00 | 1279.00 | 1225.00 | 1458.00 |
| 2021-11 | 7455.0 | 2020.00 | 1153.00 | 1273.00 | 1891.00 |
| 2021-12 | 8865.0 | 2872.00 | 2118.00 | 1619.00 | 1727.00 |
| 2022-01 | 12223.0 | 3872.00 | 2554.00 | 1820.00 | 2504.00 |
| 2022-02 | 3620.0 | 1648.00 | 1161.00 | 1172.00 | 1184.00 |
| 2022-03 | 5006.0 | 2333.00 | 1131.00 | 1101.00 | 1223.00 |
| 2022-04 | 7528.0 | 2144.00 | 1167.00 | 1225.00 | 1680.00 |
| 2022-05 | 8110.0 | 20529.00 | 1326.00 | 1229.00 | 1509.00 |
| 2022-06 | 9112.0 | 21624.00 | 1103.00 | 906.00 | 1019.00 |
| 2022-07 | 10268.0 | 4255.00 | 3931.00 | 3061.00 | 1757.00 |
| 2022-08 | 17969.0 | 10034.00 | 6358.00 | 5666.00 | 3177.00 |
| 2022-09 | 20162.0 | 10399.00 | 6607.00 | 7169.00 | 3887.00 |
| 2022-10 | 20790.0 | 7277.00 | 7148.00 | 7093.00 | 3481.00 |
| Durchschnitt | 11423.6 | 5446.56 | 2140.92 | 2276.76 | 2061.88 |
Visualisierung#
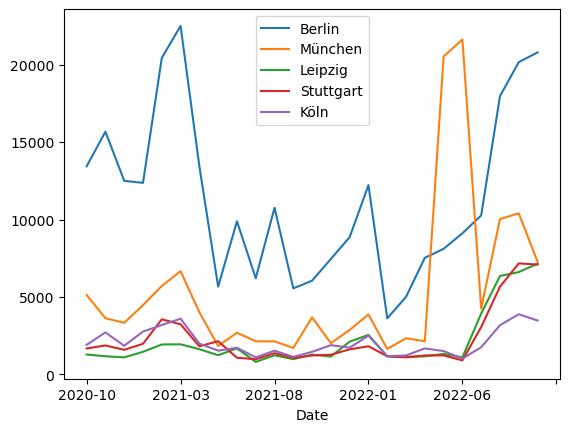
Visualisiere die Seitenaufrufe deiner gewählten Seiten, aber ohne den Durchschnittswert auszugeben.
# Code
Show code cell source
import matplotlib
fig = df.drop('Durchschnitt').plot(kind='line').get_figure()
Speichere deinen DataFrame in einer Markdown-Datei und auch das Ergebnis der Visualisierung als png-Datei.
# Code
Show code cell source
df.to_csv('out/Stadt-Daten.csv')
fig.savefig('out/Stadt-graph.png')
---------------------------------------------------------------------------
OSError                                   Traceback (most recent call last)
Cell In [21], line 1
----> 1 df.to_csv('out/Stadt-Daten.csv')
      2 fig.savefig('out/Stadt-graph.png')

File ~/anaconda3/envs/rise-environment/lib/python3.10/site-packages/pandas/util/_decorators.py:211, in deprecate_kwarg.<locals>._deprecate_kwarg.<locals>.wrapper(*args, **kwargs)
    209     else:
    210         kwargs[new_arg_name] = new_arg_value
--> 211 return func(*args, **kwargs)

File ~/anaconda3/envs/rise-environment/lib/python3.10/site-packages/pandas/core/generic.py:3720, in NDFrame.to_csv(self, path_or_buf, sep, na_rep, float_format, columns, header, index, index_label, mode, encoding, compression, quoting, quotechar, lineterminator, chunksize, date_format, doublequote, escapechar, decimal, errors, storage_options)
   3709 df = self if isinstance(self, ABCDataFrame) else self.to_frame()
   3711 formatter = DataFrameFormatter(
   3712     frame=df,
   3713     header=header,
   (...)
   3717     decimal=decimal,
   3718 )
-> 3720 return DataFrameRenderer(formatter).to_csv(
   3721     path_or_buf,
   3722     lineterminator=lineterminator,
   3723     sep=sep,
   3724     encoding=encoding,
   3725     errors=errors,
   3726     compression=compression,
   3727     quoting=quoting,
   3728     columns=columns,
   3729     index_label=index_label,
   3730     mode=mode,
   3731     chunksize=chunksize,
   3732     quotechar=quotechar,
   3733     date_format=date_format,
   3734     doublequote=doublequote,
   3735     escapechar=escapechar,
   3736     storage_options=storage_options,
   3737 )

File ~/anaconda3/envs/rise-environment/lib/python3.10/site-packages/pandas/util/_decorators.py:211, in deprecate_kwarg.<locals>._deprecate_kwarg.<locals>.wrapper(*args, **kwargs)
    209     else:
    210         kwargs[new_arg_name] = new_arg_value
--> 211 return func(*args, **kwargs)

File ~/anaconda3/envs/rise-environment/lib/python3.10/site-packages/pandas/io/formats/format.py:1189, in DataFrameRenderer.to_csv(self, path_or_buf, encoding, sep, columns, index_label, mode, compression, quoting, quotechar, lineterminator, chunksize, date_format, doublequote, escapechar, errors, storage_options)
   1168     created_buffer = False
   1170 csv_formatter = CSVFormatter(
   1171     path_or_buf=path_or_buf,
   1172     lineterminator=lineterminator,
   (...)
   1187     formatter=self.fmt,
   1188 )
-> 1189 csv_formatter.save()
   1191 if created_buffer:
   1192     assert isinstance(path_or_buf, StringIO)

File ~/anaconda3/envs/rise-environment/lib/python3.10/site-packages/pandas/io/formats/csvs.py:241, in CSVFormatter.save(self)
    237 """
    238 Create the writer & save.
    239 """
    240 # apply compression and byte/text conversion
--> 241 with get_handle(
    242     self.filepath_or_buffer,
    243     self.mode,
    244     encoding=self.encoding,
    245     errors=self.errors,
    246     compression=self.compression,
    247     storage_options=self.storage_options,
    248 ) as handles:
    249
    250     # Note: self.encoding is irrelevant here
    251     self.writer = csvlib.writer(
    252         handles.handle,
    253         lineterminator=self.lineterminator,
   (...)
    258         quotechar=self.quotechar,
    259     )
    261     self._save()

File ~/anaconda3/envs/rise-environment/lib/python3.10/site-packages/pandas/io/common.py:734, in get_handle(path_or_buf, mode, encoding, compression, memory_map, is_text, errors, storage_options)
    732 # Only for write methods
    733 if "r" not in mode and is_path:
--> 734     check_parent_directory(str(handle))
    736 if compression:
    737     if compression != "zstd":
    738         # compression libraries do not like an explicit text-mode

File ~/anaconda3/envs/rise-environment/lib/python3.10/site-packages/pandas/io/common.py:597, in check_parent_directory(path)
    595 parent = Path(path).parent
    596 if not parent.is_dir():
--> 597     raise OSError(rf"Cannot save file into a non-existent directory: '{parent}'")

OSError: Cannot save file into a non-existent directory: 'out'
Rechercheaufgabe#
Input/Output in Python#
Recherchiere zuerst was JSON, TXT und PICKLE ist. Schreibe deine Daten (Name, E-Mail-Adresse, Traumberuf) in ein dictionary. Speichere dieses Dictionary anschließend in drei Versionen: ‘visitenkarte.txt’, ‘visitenkarte.json’ und ‘visitenkarte.pkl’ relativ zu deinem Arbeitsverzeichnis in dem Ordner ‘meine_visitenkarten’.
# Code
Show code cell source
visitenkarte = {'Name': 'Max Mustermann', 'E-Mail-Adresse': 'max@muster.de', 'Traumberuf': 'Passbild-Model'}

vdf = pd.DataFrame(visitenkarte.items())

vdf.to_csv('out/visitenkarte.csv')

vdf.to_json('out/visitenkarte.json')

vdf.to_pickle('out/visitenkarte.pkl')
Lese die Datei ‘visitenkarte.json’ jetzt ein und gib in der Konsole den Traumberuf aus. Versuche das Gleiche mit den anderen Dateitypen
# Code
["{'Name': 'Jonas', 'Mail': 'jr74xaqo', 'Traumberuf': 'Feuerwehr'}"]
Show code cell source
pickleDF = pd.read_pickle('out/visitenkarte.pkl')

jsonDF = pd.read_json('out/visitenkarte.json')

csvDF = pd.read_csv('out/visitenkarte.csv')

jsonDF