Visualisierung#
Ziel#
Wir visualisieren die Daten im EM-DAT Datensatz

# Install a pip package im Jupyter Notebook
!pip3 install pandas
import pandas as pd
data = pd.read_csv('../../data/clean_emdat.csv', index_col=0)
data
| Year | Country | Disaster Subroup | Disaster Type | Disaster Subtype | Total Events | Total Affected | Total Deaths | Total Damage (USD, original) | CPI | |
|---|---|---|---|---|---|---|---|---|---|---|
| 1 | 1900 | Cabo Verde | Climatological | Drought | Drought | 1 | 11000.0 | 11000.0 | NaN | 3.077091 |
| 2 | 1900 | India | Climatological | Drought | Drought | 1 | 1250000.0 | 1250000.0 | NaN | 3.077091 |
| 3 | 1900 | Jamaica | Hydrological | Flood | No Subtype | 1 | 300.0 | 300.0 | NaN | 3.077091 |
| 4 | 1900 | Japan | Geophysical | Volcanic activity | Ash fall | 1 | 30.0 | 30.0 | NaN | 3.077091 |
| 5 | 1900 | Turkey | Geophysical | Earthquake | Ground movement | 1 | 140.0 | 140.0 | NaN | 3.077091 |
| ... | ... | ... | ... | ... | ... | ... | ... | ... | ... | ... |
| 10338 | 2022 | Yemen | Hydrological | Flood | Flash flood | 1 | 3400.0 | 13.0 | NaN | NaN |
| 10339 | 2022 | South Africa | Hydrological | Flood | No Subtype | 7 | 143119.0 | 562.0 | 3.164000e+09 | NaN |
| 10340 | 2022 | Zambia | Hydrological | Flood | No Subtype | 1 | 15000.0 | 3.0 | NaN | NaN |
| 10341 | 2022 | Zimbabwe | Hydrological | Flood | No Subtype | 1 | 0.0 | 0.0 | NaN | NaN |
| 10342 | 2022 | Zimbabwe | Meteorological | Storm | Tropical cyclone | 1 | 3000.0 | 0.0 | NaN | NaN |
10342 rows × 10 columns
data.info()
<class 'pandas.core.frame.DataFrame'>
Int64Index: 10342 entries, 1 to 10342
Data columns (total 10 columns):
 #   Column                        Non-Null Count  Dtype
---  ------                        --------------  -----
 0   Year                          10342 non-null  int64
 1   Country                       10342 non-null  object
 2   Disaster Subroup              10342 non-null  object
 3   Disaster Type                 10342 non-null  object
 4   Disaster Subtype              10342 non-null  object
 5   Total Events                  10342 non-null  int64
 6   Total Affected                10342 non-null  float64
 7   Total Deaths                  10342 non-null  float64
 8   Total Damage (USD, original)  3796 non-null   float64
 9   CPI                           10149 non-null  float64
dtypes: float64(4), int64(2), object(4)
memory usage: 888.8+ KB
Das Dashboard…#
Recherchefragen#
Wie viele Todesopfer gibt es in einem Land?
Wie stark ist ein Land von Naturkatastrophen betroffen?
Welchen Anteil haben die unterschiedlichen Naturkatastrophentypen daran?
Wie hat sich die Anzahl der Naturkatastrophen über die Jahre hin entwickelt?
Wie viele Todesopfer gibt es in einem Land?#
Wie viele Todesopfer gibt es insgesamt?#
data["Total Deaths"].sum()
22845977.0
Wie viele Todesopfer gibt es insgesamt in Deutschland?#
data['Country'] == 'Germany'
1        False
2        False
3        False
4        False
5        False
         ...
10338    False
10339    False
10340    False
10341    False
10342    False
Name: Country, Length: 10342, dtype: bool
data[data['Country'] == 'Germany']
| Year | Country | Disaster Subroup | Disaster Type | Disaster Subtype | Total Events | Total Affected | Total Deaths | Total Damage (USD, original) | CPI | |
|---|---|---|---|---|---|---|---|---|---|---|
| 3121 | 1990 | Germany | Meteorological | Storm | No Subtype | 6 | 64.0 | 64.0 | 4.440000e+09 | 48.218797 |
| 3289 | 1991 | Germany | Meteorological | Storm | No Subtype | 1 | 0.0 | 0.0 | 5.000000e+06 | 50.260853 |
| 3431 | 1992 | Germany | Geophysical | Earthquake | Ground movement | 1 | 1525.0 | 1.0 | 5.000000e+07 | 51.783162 |
| 3432 | 1992 | Germany | Hydrological | Flood | No Subtype | 1 | 0.0 | 0.0 | 3.010000e+07 | 51.783162 |
| 3582 | 1993 | Germany | Hydrological | Flood | Riverine flood | 1 | 100000.0 | 5.0 | 6.000000e+08 | 53.311620 |
| ... | ... | ... | ... | ... | ... | ... | ... | ... | ... | ... |
| 9469 | 2019 | Germany | Meteorological | Storm | Convective storm | 1 | 1.0 | 1.0 | NaN | 94.349092 |
| 9708 | 2020 | Germany | Meteorological | Storm | Extra-tropical storm | 1 | 33.0 | 0.0 | NaN | 95.512967 |
| 9952 | 2021 | Germany | Hydrological | Flood | No Subtype | 1 | 1000.0 | 197.0 | 4.000000e+10 | 100.000000 |
| 9953 | 2021 | Germany | Meteorological | Storm | Convective storm | 2 | 604.0 | 1.0 | NaN | 100.000000 |
| 10188 | 2022 | Germany | Meteorological | Storm | Extra-tropical storm | 3 | 2.0 | 7.0 | NaN | NaN |
66 rows × 10 columns
data[data['Country'] == 'Germany']['Total Deaths'].sum()
9918.0
data_germany = data[data['Country'] == 'Germany']
data_germany['Total Deaths'].sum()
9918.0
Wie viele Todesopfer gab es insgesamt in Indien?#
data_land = data[data['Country'] == 'India']
data_land['Total Deaths'].sum()
4591827.0
Allgemeine Funktion die Gesamtzahl der Todesopfer eines Landes ausgibt#
def get_total_deaths(data, country):
    data_land = data[data['Country'] == country]
    return data_land['Total Deaths'].sum()
get_total_deaths(data, 'Japan')
239400.0
get_total_deaths(data, 'Sweden')
43.0
get_total_deaths(data, 'South Africa')
2576.0
Dashboard Teil II#
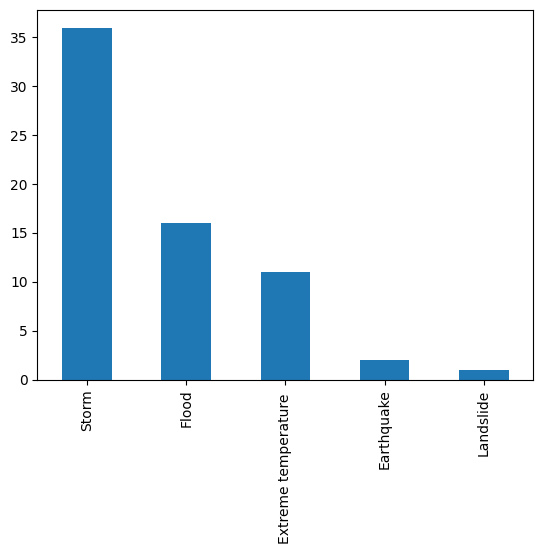
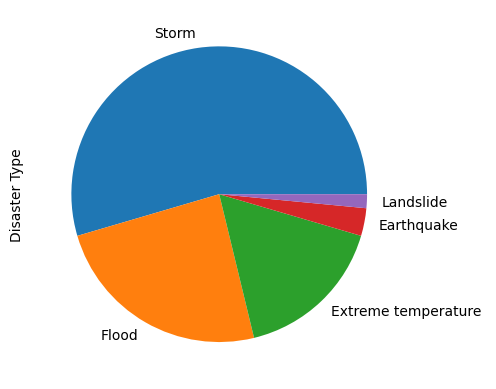
Welchen Anteil haben die unterschiedlichen Naturkatastrophentypen in Deutschland?#
germany_data = data[data['Country'] == 'Germany']
germany_data['Disaster Type'].value_counts(normalize=True)
Storm                   0.545455
Flood                   0.242424
Extreme temperature     0.166667
Earthquake              0.030303
Landslide               0.015152
Name: Disaster Type, dtype: float64
Visualisierung von DataFrames#
Matplotlib is a comprehensive library for creating static, animated, and interactive visualizations in Python.
Matplotlib makes easy things easy and hard things possible.
Install matplotlib:
!pip3 install --upgrade pip
!pip3 install --upgrade Pillow
!pip3 install matplotlib

import matplotlib.pyplot as plt
germany_data = data[data['Country'] == 'Germany']
germany_data['Disaster Type'].value_counts()
Storm                   36
Flood                   16
Extreme temperature     11
Earthquake               2
Landslide                1
Name: Disaster Type, dtype: int64
germany_data['Disaster Type'].value_counts().plot(kind='bar')
<AxesSubplot: >
germany_data['Disaster Type'].value_counts().plot(kind='pie')
<AxesSubplot: ylabel='Disaster Type'>
Recherchefragen#
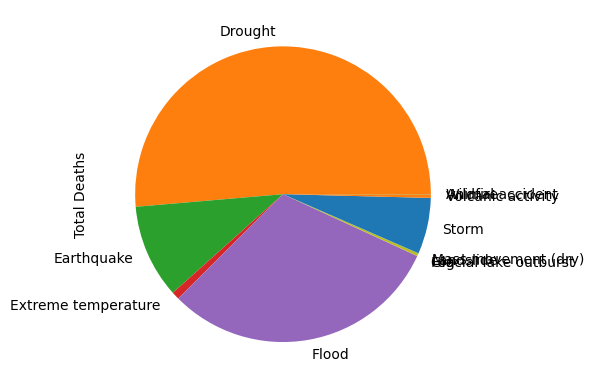
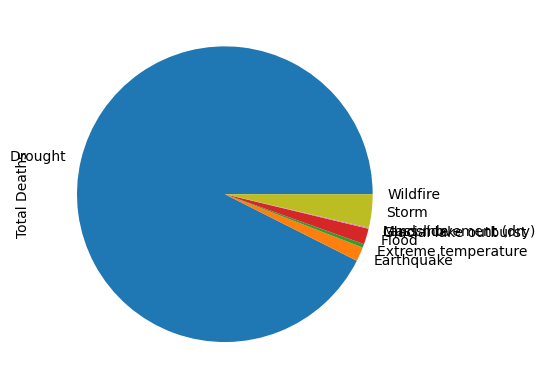
Welche Naturkatastrophen fordern die meisten Todesopfer?#
.groupby() gruppiert einen DataFrame nach den Werten einer oder mehreren Spalten.
Die Spalten nach denen man Gruppieren möchte werden als Argument übergeben. Danach folgt die gewünschte Berechnung auf dieser Gruppe. Das Ergebnis wird als DataFrame zurückgegeben.
data
| Year | Country | Disaster Subroup | Disaster Type | Disaster Subtype | Total Events | Total Affected | Total Deaths | Total Damage (USD, original) | CPI | |
|---|---|---|---|---|---|---|---|---|---|---|
| 1 | 1900 | Cabo Verde | Climatological | Drought | Drought | 1 | 11000.0 | 11000.0 | NaN | 3.077091 |
| 2 | 1900 | India | Climatological | Drought | Drought | 1 | 1250000.0 | 1250000.0 | NaN | 3.077091 |
| 3 | 1900 | Jamaica | Hydrological | Flood | No Subtype | 1 | 300.0 | 300.0 | NaN | 3.077091 |
| 4 | 1900 | Japan | Geophysical | Volcanic activity | Ash fall | 1 | 30.0 | 30.0 | NaN | 3.077091 |
| 5 | 1900 | Turkey | Geophysical | Earthquake | Ground movement | 1 | 140.0 | 140.0 | NaN | 3.077091 |
| ... | ... | ... | ... | ... | ... | ... | ... | ... | ... | ... |
| 10338 | 2022 | Yemen | Hydrological | Flood | Flash flood | 1 | 3400.0 | 13.0 | NaN | NaN |
| 10339 | 2022 | South Africa | Hydrological | Flood | No Subtype | 7 | 143119.0 | 562.0 | 3.164000e+09 | NaN |
| 10340 | 2022 | Zambia | Hydrological | Flood | No Subtype | 1 | 15000.0 | 3.0 | NaN | NaN |
| 10341 | 2022 | Zimbabwe | Hydrological | Flood | No Subtype | 1 | 0.0 | 0.0 | NaN | NaN |
| 10342 | 2022 | Zimbabwe | Meteorological | Storm | Tropical cyclone | 1 | 3000.0 | 0.0 | NaN | NaN |
10342 rows × 10 columns
data['Total Deaths'].sum()
22845977.0
data.groupby('Disaster Type')['Total Deaths'].sum()
Disaster Type
Animal accident                12.0
Drought                  11733889.0
Earthquake                2343594.0
Extreme temperature        194056.0
Flood                     7002950.0
Fog                          4000.0
Glacial lake outburst         262.0
Insect infestation              0.0
Landslide                   67417.0
Mass movement (dry)          4644.0
Storm                     1403607.0
Volcanic activity           86893.0
Wildfire                     4653.0
Name: Total Deaths, dtype: float64
data.groupby('Disaster Type').sum()
/tmp/ipykernel_88481/3612715955.py:1: FutureWarning: The default value of numeric_only in DataFrameGroupBy.sum is deprecated. In a future version, numeric_only will default to False. Either specify numeric_only or select only columns which should be valid for the function.
  data.groupby('Disaster Type').sum()
| Year | Total Events | Total Affected | Total Deaths | Total Damage (USD, original) | CPI | |
|---|---|---|---|---|---|---|
| Disaster Type | ||||||
| Animal accident | 2014 | 1 | 5.000000e+00 | 12.0 | 0.000000e+00 | 87.366298 |
| Drought | 1543555 | 792 | 2.869852e+09 | 11733889.0 | 2.098881e+11 | 43039.824471 |
| Earthquake | 2134925 | 1576 | 2.052983e+08 | 2343594.0 | 8.653494e+11 | 46522.663819 |
| Extreme temperature | 1115693 | 607 | 1.038223e+08 | 194056.0 | 6.886634e+10 | 38106.532522 |
| Flood | 7604541 | 5730 | 3.967537e+09 | 7002950.0 | 9.771118e+11 | 239869.775450 |
| Fog | 1952 | 1 | 4.000000e+03 | 4000.0 | 0.000000e+00 | 9.822074 |
| Glacial lake outburst | 4043 | 3 | 3.600000e+01 | 262.0 | 2.100000e+08 | 100.000000 |
| Insect infestation | 183314 | 95 | 2.802200e+06 | 0.0 | 2.292000e+08 | 4880.908507 |
| Landslide | 1277348 | 789 | 1.480567e+07 | 67417.0 | 1.125893e+10 | 36989.405750 |
| Mass movement (dry) | 93320 | 48 | 3.105800e+04 | 4644.0 | 2.090000e+08 | 2269.255805 |
| Storm | 5473348 | 4579 | 1.256494e+09 | 1403607.0 | 1.749046e+12 | 149355.146763 |
| Volcanic activity | 457628 | 269 | 1.004262e+07 | 86893.0 | 6.326912e+09 | 12030.182594 |
| Wildfire | 744227 | 453 | 1.836880e+07 | 4653.0 | 1.290320e+11 | 23624.803026 |
.groupby() kann auch auf mehrere Spalten gleichzeitig angewendet werden
data.groupby(['Disaster Type', 'Disaster Subtype'])['Total Deaths'].sum()
Disaster Type          Disaster Subtype
Animal accident        No Subtype                                12.0
Drought                Drought                             11733812.0
                       No Subtype                                77.0
Earthquake             Ground movement                      2075949.0
                       No Subtype                               221.0
                       Tsunami                               267424.0
Extreme temperature    Cold wave                              17765.0
                       Heat wave                             172555.0
                       Severe winter conditions                3736.0
Flood                  Coastal flood                           5352.0
                       Flash flood                            70835.0
                       No Subtype                           2480837.0
                       Riverine flood                       4445926.0
Fog                    No Subtype                              4000.0
Glacial lake outburst  No Subtype                               262.0
Insect infestation     Grasshopper                                0.0
                       Locust                                     0.0
                       No Subtype                                 0.0
Landslide              Avalanche                               5227.0
                       Landslide                              41435.0
                       Mudslide                                4913.0
                       No Subtype                             15427.0
                       Rockfall                                 128.0
                       Subsidence                               287.0
Mass movement (dry)    Avalanche                                349.0
                       Landslide                               3774.0
                       No Subtype                                10.0
                       Rockfall                                 477.0
                       Subsidence                                34.0
Storm                  Convective storm                       22730.0
                       Extra-tropical storm                     558.0
                       No Subtype                             25135.0
                       Tropical cyclone                     1355184.0
Volcanic activity      Ash fall                               85831.0
                       Lava flow                                 33.0
                       No Subtype                               516.0
                       Pyroclastic flow                         513.0
Wildfire               Forest fire                             3334.0
                       Land fire (Brush, Bush, Pasture)         966.0
                       No Subtype                               353.0
Name: Total Deaths, dtype: float64
Visualisierung#
data.groupby('Disaster Type')['Total Deaths'].sum().plot(kind='pie')
<AxesSubplot: ylabel='Total Deaths'>
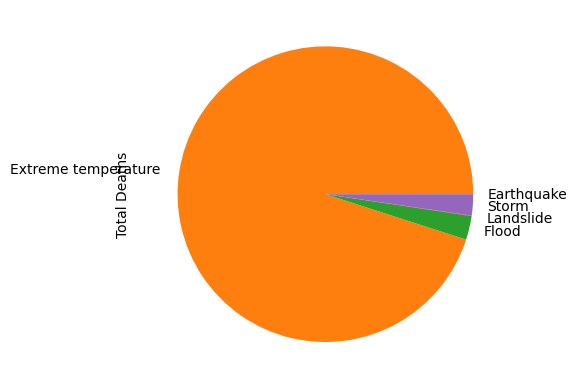
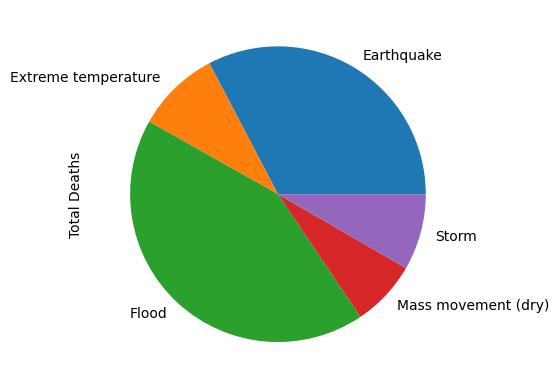
Welche Naturkatastrophen fordern die meisten Todesopfer in Deutschland?#
germany_data = data[data['Country'] == 'Germany']
germany_data.groupby('Disaster Type')['Total Deaths'].sum().plot(kind='pie')
<AxesSubplot: ylabel='Total Deaths'>
Generelle Funktion#
country = 'India'
country_data = data[data['Country'] == country]
country_data.groupby('Disaster Type')['Total Deaths'].sum().plot(kind='pie')
<AxesSubplot: ylabel='Total Deaths'>
def plot_death_by_disastertype(data, country):
    country_data = data[data['Country'] == country]
    country_data.groupby('Disaster Type')['Total Deaths'].sum().plot(kind='pie')
plot_death_by_disastertype(data, 'Egypt')
Dashboard Teil III#
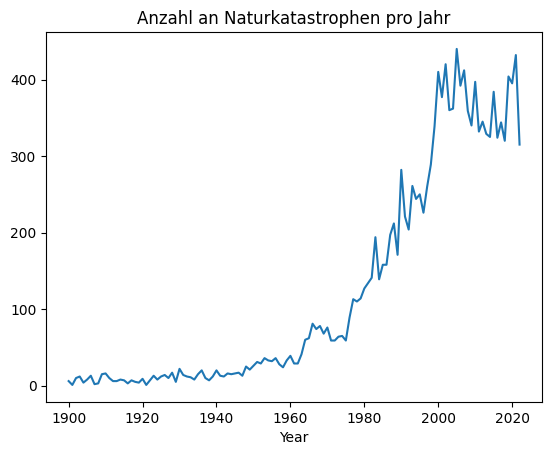
Wie hat sich die Anzahl der Naturkatastrophen über die Jahre hin entwickelt?#
Berechne für jedes Jahr die Summe aus allen Events
data.groupby('Year')['Total Events'].sum()
Year
1900      6
1901      1
1902     10
1903     12
1904      4
       ...
2018    320
2019    404
2020    395
2021    432
2022    315
Name: Total Events, Length: 123, dtype: int64
data['Total Events'].sum()
14943
data.groupby('Year').min()
| Country | Disaster Subroup | Disaster Type | Disaster Subtype | Total Events | Total Affected | Total Deaths | Total Damage (USD, original) | CPI | |
|---|---|---|---|---|---|---|---|---|---|
| Year | |||||||||
| 1900 | Cabo Verde | Climatological | Drought | Ash fall | 1 | 30.0 | 30.0 | 30000000.0 | 3.077091 |
| 1901 | Japan | Geophysical | Earthquake | Tsunami | 1 | 24.0 | 18.0 | NaN | 3.077091 |
| 1902 | Azerbaijan | Geophysical | Earthquake | Ash fall | 1 | 125.0 | 86.0 | 25000000.0 | 3.200175 |
| 1903 | Canada | Climatological | Drought | Ash fall | 1 | 0.0 | 0.0 | 480000000.0 | 3.323258 |
| 1904 | Bangladesh | Geophysical | Earthquake | Ground movement | 1 | 0.0 | 0.0 | NaN | 3.323258 |
| ... | ... | ... | ... | ... | ... | ... | ... | ... | ... |
| 2018 | Afghanistan | Climatological | Drought | Ash fall | 1 | 0.0 | 0.0 | 36000.0 | 92.669670 |
| 2019 | Afghanistan | Biological | Drought | Ash fall | 1 | 0.0 | 0.0 | 4000000.0 | 94.349092 |
| 2020 | Afghanistan | Biological | Drought | Ash fall | 1 | 0.0 | 0.0 | 1500000.0 | 95.512967 |
| 2021 | Afghanistan | Climatological | Drought | Ash fall | 1 | 0.0 | 0.0 | 120000.0 | 100.000000 |
| 2022 | Afghanistan | Climatological | Drought | Ash fall | 1 | 0.0 | 0.0 | 240000.0 | NaN |
123 rows × 9 columns
data[['Total Events', 'Year']].groupby('Year')['Total Events'].sum()
Year
1900      6
1901      1
1902     10
1903     12
1904      4
       ...
2018    320
2019    404
2020    395
2021    432
2022    315
Name: Total Events, Length: 123, dtype: int64
yearly_events = data.groupby('Year')['Total Events'].sum()
yearly_events.plot(kind='line', x='Year', y='Total Events', title='Anzahl an Naturkatastrophen pro Jahr')
<AxesSubplot: title={'center': 'Anzahl an Naturkatastrophen pro Jahr'}, xlabel='Year'>
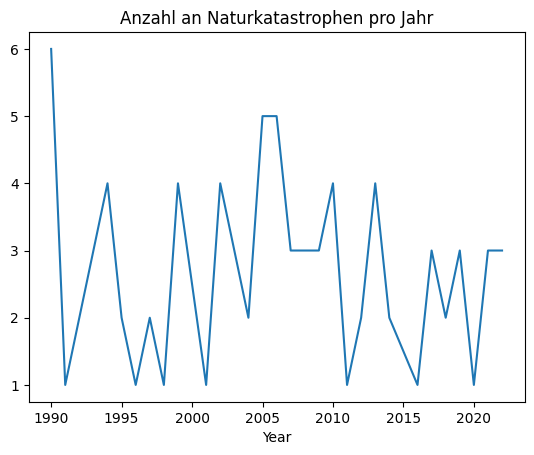
Plotte für Deutschland die Entwicklung der Anzahl an Naturkatastrophen über die Jahre hinweg
yearly_events =germany_data.groupby('Year')['Total Events'].sum()
yearly_events.plot(kind='line', x='Year', y='Total Events', title='Anzahl an Naturkatastrophen pro Jahr')
<AxesSubplot: title={'center': 'Anzahl an Naturkatastrophen pro Jahr'}, xlabel='Year'>
Generelle Funktion
def plot_evolution(data, country):
    land_data = data[data['Country'] == county]
    yearly_events = land_data.groupby('Year')['Total Events'].sum()
    yearly_events.plot(kind='line', x='Year', y='Total Events', title='Anzahl an Naturkatastrophen pro Jahr')