Natural Disasters Dashboard#

The Dataset#

Aggregated figures for Natural Disasters in EM-DAT#

Link: https://data.humdata.org/dataset/emdat-country-profiles

In 1988, the Centre for Research on the Epidemiology of Disasters (CRED) launched the Emergency Events Database (EM-DAT). EM-DAT was created with the initial support of the World Health Organisation (WHO) and the Belgian Government.

The main objective of the database is to serve the purposes of humanitarian action at national and international levels. The initiative aims to rationalise decision making for disaster preparedness, as well as provide an objective base for vulnerability assessment and priority setting.

EM-DAT contains essential core data on the occurrence and effects of over 22,000 mass disasters in the world from 1900 to the present day. The database is compiled from various sources, including UN agencies, non-governmental organisations, insurance companies, research institutes and press agencies.

Recherchefragen#

  • Wie stark ist ein Land von Naturkatastrophen betroffen?

  • Wie viele Todesopfer gibt es insgesamt?

  • Welchen Anteil haben die unterschiedlichen Naturkatastrophentypen daran?

  • Wie hat sich die Anzahl der Naturkatastrophen über die Jahre hin entwickelt?

# Install all necessary packages
!pip3 install --upgrade pip
!pip3 install --upgrade Pillow
!pip3 install matplotlib
!pip3 install pandas
Hide code cell output
Requirement already satisfied: pip in /home/natalie/Dokumente/Datenjournalismus in Python/Code/.venv/lib/python3.11/site-packages (23.3.1)
Requirement already satisfied: Pillow in /home/natalie/Dokumente/Datenjournalismus in Python/Code/.venv/lib/python3.11/site-packages (10.1.0)
Requirement already satisfied: matplotlib in /home/natalie/Dokumente/Datenjournalismus in Python/Code/.venv/lib/python3.11/site-packages (3.8.2)
Requirement already satisfied: contourpy>=1.0.1 in /home/natalie/Dokumente/Datenjournalismus in Python/Code/.venv/lib/python3.11/site-packages (from matplotlib) (1.2.0)
Requirement already satisfied: cycler>=0.10 in /home/natalie/Dokumente/Datenjournalismus in Python/Code/.venv/lib/python3.11/site-packages (from matplotlib) (0.12.1)
Requirement already satisfied: fonttools>=4.22.0 in /home/natalie/Dokumente/Datenjournalismus in Python/Code/.venv/lib/python3.11/site-packages (from matplotlib) (4.46.0)
Requirement already satisfied: kiwisolver>=1.3.1 in /home/natalie/Dokumente/Datenjournalismus in Python/Code/.venv/lib/python3.11/site-packages (from matplotlib) (1.4.5)
Requirement already satisfied: numpy<2,>=1.21 in /home/natalie/Dokumente/Datenjournalismus in Python/Code/.venv/lib/python3.11/site-packages (from matplotlib) (1.26.2)
Requirement already satisfied: packaging>=20.0 in /home/natalie/Dokumente/Datenjournalismus in Python/Code/.venv/lib/python3.11/site-packages (from matplotlib) (23.2)
Requirement already satisfied: pillow>=8 in /home/natalie/Dokumente/Datenjournalismus in Python/Code/.venv/lib/python3.11/site-packages (from matplotlib) (10.1.0)
Requirement already satisfied: pyparsing>=2.3.1 in /home/natalie/Dokumente/Datenjournalismus in Python/Code/.venv/lib/python3.11/site-packages (from matplotlib) (3.1.1)
Requirement already satisfied: python-dateutil>=2.7 in /home/natalie/Dokumente/Datenjournalismus in Python/Code/.venv/lib/python3.11/site-packages (from matplotlib) (2.8.2)
Requirement already satisfied: six>=1.5 in /home/natalie/Dokumente/Datenjournalismus in Python/Code/.venv/lib/python3.11/site-packages (from python-dateutil>=2.7->matplotlib) (1.16.0)
Requirement already satisfied: pandas in /home/natalie/Dokumente/Datenjournalismus in Python/Code/.venv/lib/python3.11/site-packages (2.1.3)
Requirement already satisfied: numpy<2,>=1.23.2 in /home/natalie/Dokumente/Datenjournalismus in Python/Code/.venv/lib/python3.11/site-packages (from pandas) (1.26.2)
Requirement already satisfied: python-dateutil>=2.8.2 in /home/natalie/Dokumente/Datenjournalismus in Python/Code/.venv/lib/python3.11/site-packages (from pandas) (2.8.2)
Requirement already satisfied: pytz>=2020.1 in /home/natalie/Dokumente/Datenjournalismus in Python/Code/.venv/lib/python3.11/site-packages (from pandas) (2023.3.post1)
Requirement already satisfied: tzdata>=2022.1 in /home/natalie/Dokumente/Datenjournalismus in Python/Code/.venv/lib/python3.11/site-packages (from pandas) (2023.3)
Requirement already satisfied: six>=1.5 in /home/natalie/Dokumente/Datenjournalismus in Python/Code/.venv/lib/python3.11/site-packages (from python-dateutil>=2.8.2->pandas) (1.16.0)
import pandas as pd
import matplotlib.pyplot as plt
data = pd.read_csv('../../data/clean_emdat.csv', index_col=0)
def create_title(country):
    '''takes a country string and return the title'''
    return f'\n\n Naturkatastrophen in {country} \n\n'.upper()
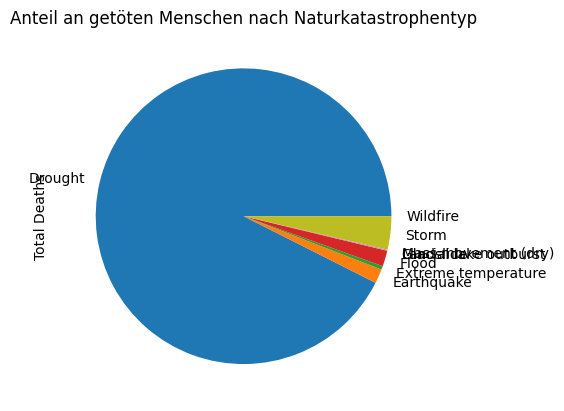
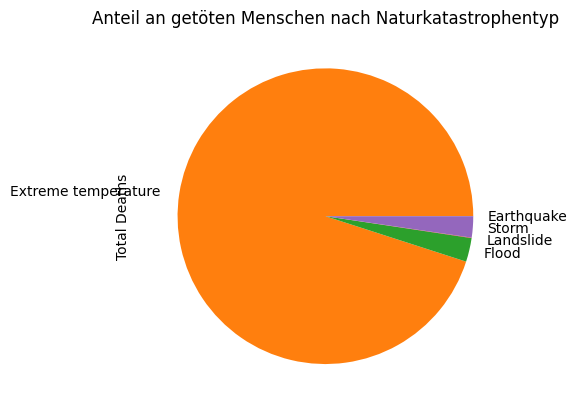
def plot_pie(country_data):
    '''creates a pie chart with the total deaths per disaster type'''
    deaths_per_disaster = country_data.groupby('Disaster Type')['Total Deaths'].sum()
    deaths_per_disaster.plot(kind='pie', title='Anteil an getöten Menschen nach Naturkatastrophentyp')
    plt.show()
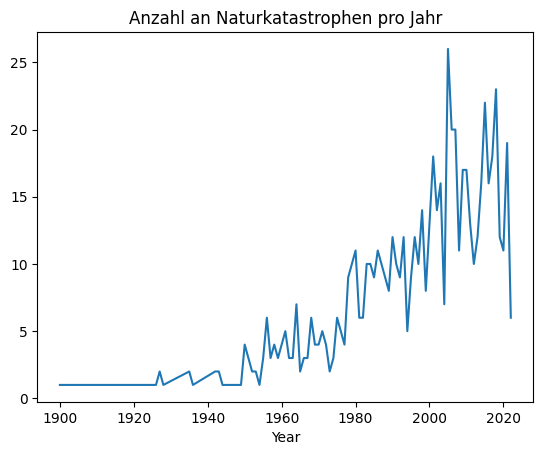
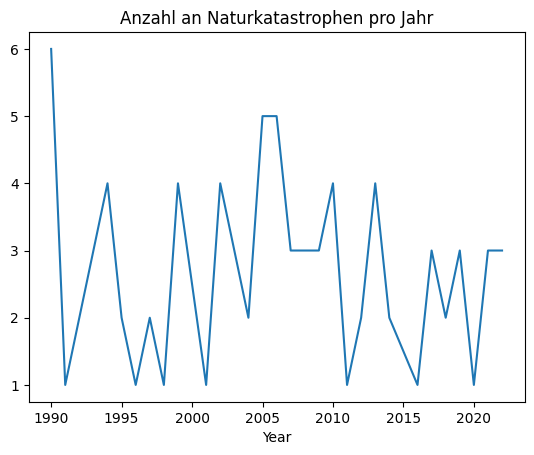
def plot_time_evolution(country_data):
    '''plots the number of natural disasters over the years'''
    yearly_events = country_data.groupby('Year')['Total Events'].sum()
    yearly_events.plot(kind='line', x='Year', y='Total Events', title='Anzahl an Naturkatastrophen pro Jahr')
    plt.show()
def death_overview(country_data):
    '''prints the total number of death people '''
    total_deaths = country_data["Total Deaths"].sum()
    print(f'Getötete Menschen seit 1900: {total_deaths:,.0f}')
def compute_anteil(country_total, world_total):
    '''computes the percentage of people affected compared to the world'''
    anteil = round(country_total / (world_total / 100.0), 2)
    print(f'{anteil}% aller Menschen die weltweit von Naturkatastrophen betroffen sind leben hier.\n')
def analyze(data, country='world'):
    '''brings all functions together to create a country report'''
    print(create_title(country))
    
    # extract the data belonging to a country
    country_data = data[data['Country'] == country]  
    # if 'world' is the argument the full dataset is evaluated
    if country == 'world':
        country_data = data
    
    # compute the number of people affected
    compute_anteil(country_data['Total Affected'].sum(), data['Total Affected'].sum())
    death_overview(country_data)
    
    # plot the graphs
    plot_pie(country_data)
    plot_time_evolution(country_data)
analyze(data, 'Germany')
 NATURKATASTROPHEN IN GERMANY 


0.01% aller Menschen die weltweit von Naturkatastrophen betroffen sind leben hier.

Getötete Menschen seit 1900: 17,935
../_images/2927769076fc55157543c3d199c3149889769d8a015ebcbf221f899ecd7b8ded.png ../_images/9adc34ec5273748d24db7c081c426b68b7ff78a00bd6eba2a78de68ac928f568.png
analyze(data, 'India')
 NATURKATASTROPHEN IN INDIA 


24.57% aller Menschen die weltweit von Naturkatastrophen betroffen sind leben hier.

Getötete Menschen seit 1900: 87,391
../_images/40b3e3f22209bd90b0ef9e7f1bbd407e5763e493663dd719c15830c23d31ae3f.png ../_images/c9455559ab463ce120519ceb901c285e735c0db6917766e129a730dedc05ead1.png